
Overview
Teaching: 15 min
Exercises: 15 minQuestionsObjectives
- How can we create a reproducible workflow?
- When to use scientific workflow management systems.
- Discuss pros/cons of GUI vs. manual steps vs. scripted vs. workflow tools.
- Get familiar with Snakemake.
One problem solved in 4 different ways
The following material is adapted from a HPC Carpentry lesson
For this episode, we will be using Binder a cloud service to make sure we all have the same computing environment. This is interesting from a reproducible research point of view and we will explain later how this is even possible!
- Go to https://mybinder.org/
- GitHub repository name or URL: https://github.com//coderefinery/word-count
- Click on the Launch button.
- Once it get started, you can open a new Terminal from the new menu (top right) and select Terminal.
The example project directory listing is:
.
├── binder
│   ├── environment.yml
├── data
│   ├── abyss.txt
│   ├── isles.txt
│   ├── last.txt
│   ├── LICENSE_TEXTS.md
│   └── sierra.txt
├── doc
│   ├── ...
│   ...
├── Dockerfile
├── LICENSE
├── Makefile
├── manuscript
├── matplotlibrc
├── processed_data
├── README.md
├── requirements.txt
├── results
├── Snakefile
└── source
    ├── plotcount.py
    ├── wordcount.py
    └── zipf_test.py
In this example we wish to:
- Analyze word frequencies using
wordcount.pyfor 4 books (they are all in thedatadirectory). - Plot a histogram using
plotcount.py. - Print the ratio between most common and second most common word for all books.
Example (for one book only) - let us test this out:
$ python source/wordcount.py data/isles.txt processed_data/isles.dat
$ python source/plotcount.py processed_data/isles.dat processed_data/isles.png
$ python source/zipf_test.py processed_data/isles.dat
Can you relate? Are you using similar setups in your research?
This was for one book - how about 3 books? How about 3000 books?
We will solve this in four different ways and discuss pros and cons.
Solution 1: Graphical user interface (GUI)
Disclaimer: not all GUIs behave this way - there exist very good GUI solutions which enable reproducibility and automation.
Imagine we have programmed a GUI with a nice interface with icons where you can select scripts and input files by clicking:
- Click on counting script
- Select book txt file
- Give a name for the dat file
- Click on a run symbol
- Click on plotting script
- Select book dat file
- Give a name for the image file
- Click on a run symbol
- …
- Go to next book …
- Click on counting script
- Select book txt file
- …
Solution 2: Manual steps
It is not too much work:
$ python source/wordcount.py data/abyss.txt processed_data/abyss.dat
$ python source/plotcount.py processed_data/abyss.dat processed_data/abyss.png

$ python source/wordcount.py data/isles.txt processed_data/isles.dat
$ python source/plotcount.py processed_data/isles.dat processed_data/isles.png

$ python source/wordcount.py data/last.txt processed_data/last.dat
$ python source/plotcount.py processed_data/last.dat processed_data/last.png

$ python source/wordcount.py data/sierra.txt processed_data/sierra.dat
$ python source/plotcount.py processed_data/sierra.dat processed_data/sierra.png

$ python source/zipf_test.py processed_data/abyss.dat processed_data/isles.dat processed_data/last.dat processed_data/sierra.dat
This is imperative style: first do this, then to that, then do that, finally do …
Solution 3: Script
Let’s express it more compactly with a shell script (Bash). Let’s call it script.sh:
#!/usr/bin/env bash

# loop over all books
for title in abyss isles last sierra; do
    python source/wordcount.py data/${title}.txt processed_data/${title}.dat
    python source/plotcount.py processed_data/${title}.dat processed_data/${title}.png
done

# this could be done using variables but nevermind
python source/zipf_test.py processed_data/abyss.dat processed_data/isles.dat processed_data/last.dat processed_data/sierra.dat
We can run it with:
$ bash script.sh
This is still imperative style: we tell the script to run these steps in precisely this order.
Solution 4: Using Snakemake
Snakemake is inspired by GNU Make, but based on Python and is more general and has easier syntax. The workflow below can also be implemented using make.
First study the Snakefile:
# a list of all the books we are analyzing
DATA = glob_wildcards('data/{book}.txt').book

# this is for running on HPC resources
localrules: all, make_archive

# the default rule
rule all:
    input:
        'zipf_analysis.tar.gz'

# count words in one of our books
# logfiles from each run are put in .log files"
rule count_words:
    input:
        wc='source/wordcount.py',
        book='data/{file}.txt'
    output: 'processed_data/{file}.dat'
    log: 'processed_data/{file}.log'
    shell: 'python {input.wc} {input.book} {output} >> {log} 2>&1'

# create a plot for each book
rule make_plot:
    input:
        plotcount='source/plotcount.py',
        book='processed_data/{file}.dat'
    output: 'results/{file}.png'
    shell: 'python {input.plotcount} {input.book} {output}'

# generate summary table
rule zipf_test:
    input:
        zipf='source/zipf_test.py',
        books=expand('processed_data/{book}.dat', book=DATA)
    output: 'results/results.txt'
    shell:  'python {input.zipf} {input.books} > {output}'

# create an archive with all of our results
rule make_archive:
    input:
        expand('results/{book}.png', book=DATA),
        expand('processed_data/{book}.dat', book=DATA),
        'results/results.txt'
    output: 'zipf_analysis.tar.gz'
    shell: 'tar -czvf {output} {input}'
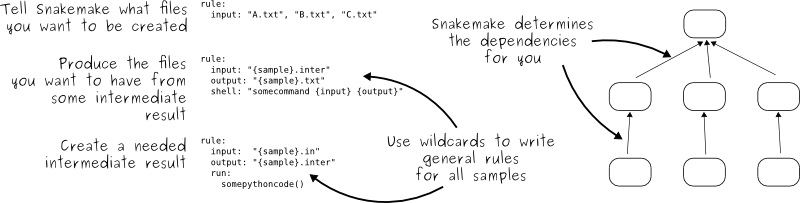
Snakemake contains rules that relate targets to dependencies and commands:
# rule (mind the tab)
target: dependencies
	command(s)
We can think of it as follows:
outputs: inputs
	command(s)
Let’s try it out. Since version 5.11 one needs to specify number
of cores (or jobs) using -j, --jobs or --cores:
$ snakemake --delete-all-output -j 1
$ snakemake -j 1
Snakemake uses declarative style: we describe dependencies but we let Snakemake figure out the series of steps to produce results (targets). Fun fact: Excel is also declarative, not imperative.
Try running snakemake again and observe that and discuss why it refused to rerun all steps:
$ snakemake -j 1

Building DAG of jobs...
Nothing to be done.
Make a modification to a txt or a dat file and run snakemake again and discuss
what you see. One way to modify files is to use the touch command which will
only update its timestamp:
$ touch results/results.txt
$ snakemake -j 1
Why Snakemake?
- Gentle learning curve.
- Free, open-source, and installs easily via conda or pip.
- Cross-platform (Windows, MacOS, Linux) and compatible with all HPC schedulers
- same workflow works without modification and scales appropriately whether on a laptop or cluster.
- Heavily used in bioinformatics, but is completely general.
Snakemake vs. Make
- Workflows defined in Python scripts extended by declarative code to define rules:
- anything that can be done in Python can be done with Snakemake
- rules work much like in GNU Make (can call any commands/executables)
- Possible to define isolated software environments per rule.
- Also possible to run workflows in Docker or Singularity containers.
- Workflows can be pushed out to run on a cluster or in the cloud without modifications to scale up.
Integrated package management
- Isolated software environments per rule using conda. Invoke by
snakemake --use-conda. Example:rule NAME: input: "table.txt" output: "plots/myplot.pdf" conda: "envs/ggplot.yaml" script: "scripts/plot-stuff.R"
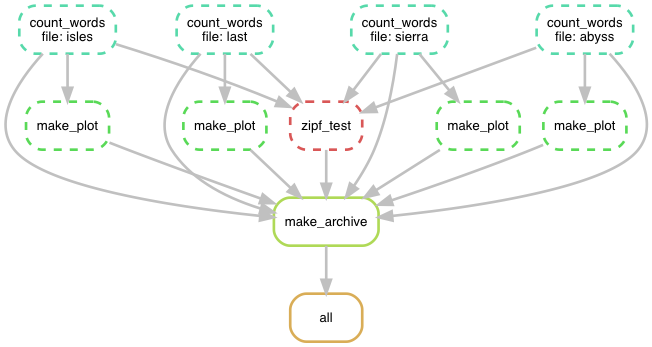
Visualizing the workflow
We can visualize the directed acyclic graph (DAG) of our current Snakefile
using the --dag option, which will output the DAG in dot language (a
plain-text format for describing graphs used by Graphviz software,
which can be installed by conda install graphviz)
$ snakemake -j 1 --dag | dot -Tpng > dag.png
Rules that have yet to be completed are indicated with solid outlines, while already completed rules are indicated with dashed outlines.
Discussion
Discuss the pros and cons of these different approaches. Which are reproducible? Which scale to hundreds of books and which can it be automated?
(optional) Snakemake in HPC
- It is possible to address and offload to non-CPU resources:
$ snakemake --delete-all-output -j 1 $ snakemake -j 4 --resources gpu=1- Transferring your workflow to a cluster:
$ snakemake --archive myworkflow.tar.gz -j 1 $ scp myworkflow.tar.gz <some-cluster> $ ssh <some-cluster> $ tar zxf myworkflow.tar.gz $ cd myworkflow $ snakemake -n --use-conda -j 1- Interoperability with Slurm:
{
  "__default__":
  {
      "account": "a_slurm_submission_account",
      "mem": "1G",
      "time": "0:5:0"
  },
  "count_words":
  {
      "time": "0:10:0",
      "mem": "2G"
  }
}
The workflow can now be executed by:
$ snakemake -j 100 --cluster-config cluster.json --cluster "sbatch -A {cluster.account} --mem={cluster.mem} -t {cluster.time} -c {threads}"Note that in this case
-jdoes not correspond to the number of cores used, instead it represents the maximum number of jobs that Snakemake is allowed to have submitted at the same time. The--cluster-configflag specifies the config file for the particular cluster, and the--clusterflag specifies the command used to submit jobs on the particular cluster.
- There is a lot more: snakemake.readthedocs.io.
Exercise using Snakemake
- Start by cleaning all output, and run snakemake (
snakemake, you may have to add-j 1to the call). How many jobs are run?- Try “touching” the file
data/sierra.txt(touch data/sierra.txt(unix/git bash) orcopy /b data\sierra.txt +,,(windows cmd /anaconda prompt) ) and rerun snakemake. Which steps of the workflow are run now, and why?- Now touch the file
processed_data/sierra.datto update the timestamp, and runsnakemake -S(-S stands for summary). Can you make sense of the output?- Rerun snakemake. Which steps are run, and why?
- Finally try touching
source/wordcount.pyand rerun snakemake. Which steps are run, and why? Should source codes be considered dependencies?- Use the
timecommand to see if you get any speedup from executing snakemake rules on multiple cores. For example to run 4 parallel threads, usetime snakemake -j 4.- Try archiving the entire workflow with
snakemake -j 1 --archive my-workflow.tar.gz.Solution
snakemake --delete-all-output -j 1, where-j 1(you could also use--cores 1instead) specifies the number of CPU cores used for execution. It should display something like deleting x, while deleting previously created files (if you ran this before, otherwise nothing). Then run the process again withsnakemake -j 1. When it is done, scroll back up to ~line 5 of the printed information. Here, the job counts are shown. If everything went well, it should have run 11 jobs, everything once, but count_words and make_plot, which was run 4 times each (once for each input book). In the text printed below this in your terminal you can see when each job was run and what was done in each job. You can also see the number of jobs shown as 11 of 11 steps (100%) done in the end of the output.touch data/sierra.txt(unix/git bash) orcopy /b data\sierra.txt +,,(windows cmd /anaconda prompt): this command updates the timestamp of the file, for the program it looks like the file has been updated/changed and will need to be reprocessed by all following steps that are depending on this output (i.e. that use this output to do something else with it). So, once you callsnakemake -j 1again, only the jobs concerning the sierra dataset will be rerun, not all the processes of unchanged files. Snakemake determines which of the following processing steps will need to be rerun once an input file is updated. Hence e.g. make_plot is also rerun, since its input (the output of count_words) ‘changed’.touch processed_data/sierra.dat(unix/git bash) orcopy /b processed_data/sierra.dat +,,(windows cmd /anaconda prompt), then runsnakemake -S(-S stands for summary). This does not run any jobs but gives an overview of what is the status (status column) of each step and what will be run the next time snakemake is run (plan column). Note that the column headers may appear not right above the columns below, check spaces to connect columns with their column names). Also note, that the default rule ‘all’ is not shown in summary.snakemake -j 1. 4 jobs are run. You may have expected 3 as in the summary only 3 steps had the upadte pending planned. However, as mentioned above, the default rule ‘all’ was not shown in summary and also needs to be executed in order to run the following steps.touch source/wordcount.py(unix/git bash) orcopy /b source/wordcount.py +,,(windows cmd /anaconda prompt), thensnakemake -j 1. Until now we only ‘changed’ the output files. Here we actually ‘change’ a script that produces these output files. Since the wordcount.py is the very first script in the workflow on whose results all other processes depend on, everything is run again. By updating the scripts timestamp, snakemake assumes something has changed in the scripts that may influence the output of the script, ans therefore also the output of every following step. Therefore it will run all the following steps again. In this case if you would actually change something in the wordcount.py script it would change the output, which means if you want your research to be rproducible, the source code as is has to be a dependency to get the same results as you did now.- The speedup achieved with running on 4 instead of 1 core might be small but it should still exist is terms of time. The example is only small, but when running tasks where each step takes much longer to run, this is one possible way of speeding things up.
- For more information, see snakemake.readthedocs.io
(Optional) Using Snakemake with conda environments
Let’s say that the
make_plotrule, which runs thesource/plotcount.pyscript, requires a separate software environment.
- Create an environment file
plotting.ymlin a new directoryenvs/. It should containconda-forgein thechannelssection and the packagesnumpy=1.17.3andmatplotlib=3.1.1in thedependenciessection.- In the
make_plotrule in the Snakefile, add acondadirective where you provide the path to the new environment file.- First clear all output and then rerun
snakemakewith the--use-condaflag. Observe how snakemake downloads and installs packages and activates the environment. The new environment is stored in.snakemake/conda/$hashwhere $hash is the MD5 hash of the environment file content. Updates to the environment definition are thus automatically detected.Solution
- Checkout the Anaconda documentation on how to manually create a yml file. Make sure to create the
plotting.ymlfile in the right directory. Open your preferred editor, and add the following:name: plotting channels: - conda-forge dependencies: - numpy=1.17.3 - matplotlib=3.1.1- The make plot part of the snakemake file should be something like this:
... # create a plot for each book rule make_plot: input: plotcount='source/plotcount.py', book='processed_data/{file}.dat' output: 'results/{file}.png' conda: "envs/plotting.yaml" shell: 'python {input.plotcount} {input.book} {output}' ...- First, run
snakemake --delete-all-output -j 1to clear all output. Then, runsnakemake --use-conda -j 1. Snakemake now, finds the
Comparison and summary
- GUIs may or may not be reproducible.
- Some GUIs can be automated, many cannot.
- Typing the same series of commands for 100 similar inputs is tedious and error prone.
- Imperative scripts are reproducible and great for automation.
- Declarative workflows such as Snakemake are great for longer multi-step analyses.
- Declarative workflows are often easy to parallelize without you changing anything.
- With declarative workflows it is no problem to add/change things late in the project.
- Interesting modern alternative to Make/Snakemake: https://taskfile.dev
- Many specialized frameworks exist.
Key Points
Preserve the steps for re-generating published results.
Hundreds of workflow management tools exist.
Snakemake is a comparatively simple and lightweight option to create transferable and scalable data analyses.
Sometimes a script is enough.